Archives for the month of: October, 2012

Image

wylbur with the evapotron on top of the truck at Camp Above the Limit.

Image

We put the evapotrons on top of trucks because up there they are exposed to sun and wind all the time. No shadows as the day gets longer. The smell and mist of grey water isn’t so nice in a crowded camp, but on top of the truck, no one notices. The truck’s roof also serves as a final catching point for overflow; splashing grey water evaporates from the top of the truck instead of getting on the playa. Finally, the location up a ladder discourages random people from dumping grey water into the system, which was a problem in 2011.

Here are the evapotrons in action at Burning Man. We eliminated over 1500 lbs of grey water. Oh yea!

The evapotron on the truck at Coffee, Tea and Me

Close up of evapotron at Coffee, Tea, and Me


View of evapotron at Above the Limit


The weight sensor was an interesting little beast. I’ll write a long post at some point about how hard it is to figure out with a sensor how much water is in a bucket. I tried the eTape liquid sensor, various electrical sensors in the water, ultrasonic measurement of the height, and finally a weight sensor. The final one was the only one that worked at all — and it didn’t work all that well. More on that later.

However, it did sort-of work, and that can be seen here in the data between 12:45pm and about 3pm on Sunday 26 Aug. The cycling from low level to a high level shows the pump’s action. When the pump is running, most of the water is up on the evaporation tower, not in the reservoir bucket, and so the weight is low. The pump shuts off, the water drains back into the bucket, and the weight goes up.

Not *all* the water drains back. In the graph above, starting at about 13:30, imagine a straight line through the tops of the line’s plateaus. That line is tracking the loss of water due to evaporation off the tower.

There are tons of complicating factors: water is added to the system, as shown in the previous post; the measured weight is noisy because the truck (on which the whole tower sits) is jostled by wind, as people move stuff around inside, and when they climb onto the truck; and occasionally the sensor reports completely nonsensical readings. I’m working on an analysis that will control all these effects to get at evaporation rates.

Figuring out how much grey water went through this machine was pretty complicated. We kept a logbook, but I worried that it would be honored “more in the breach than in the observance,” as my friend Cheddar said. He was right. Image

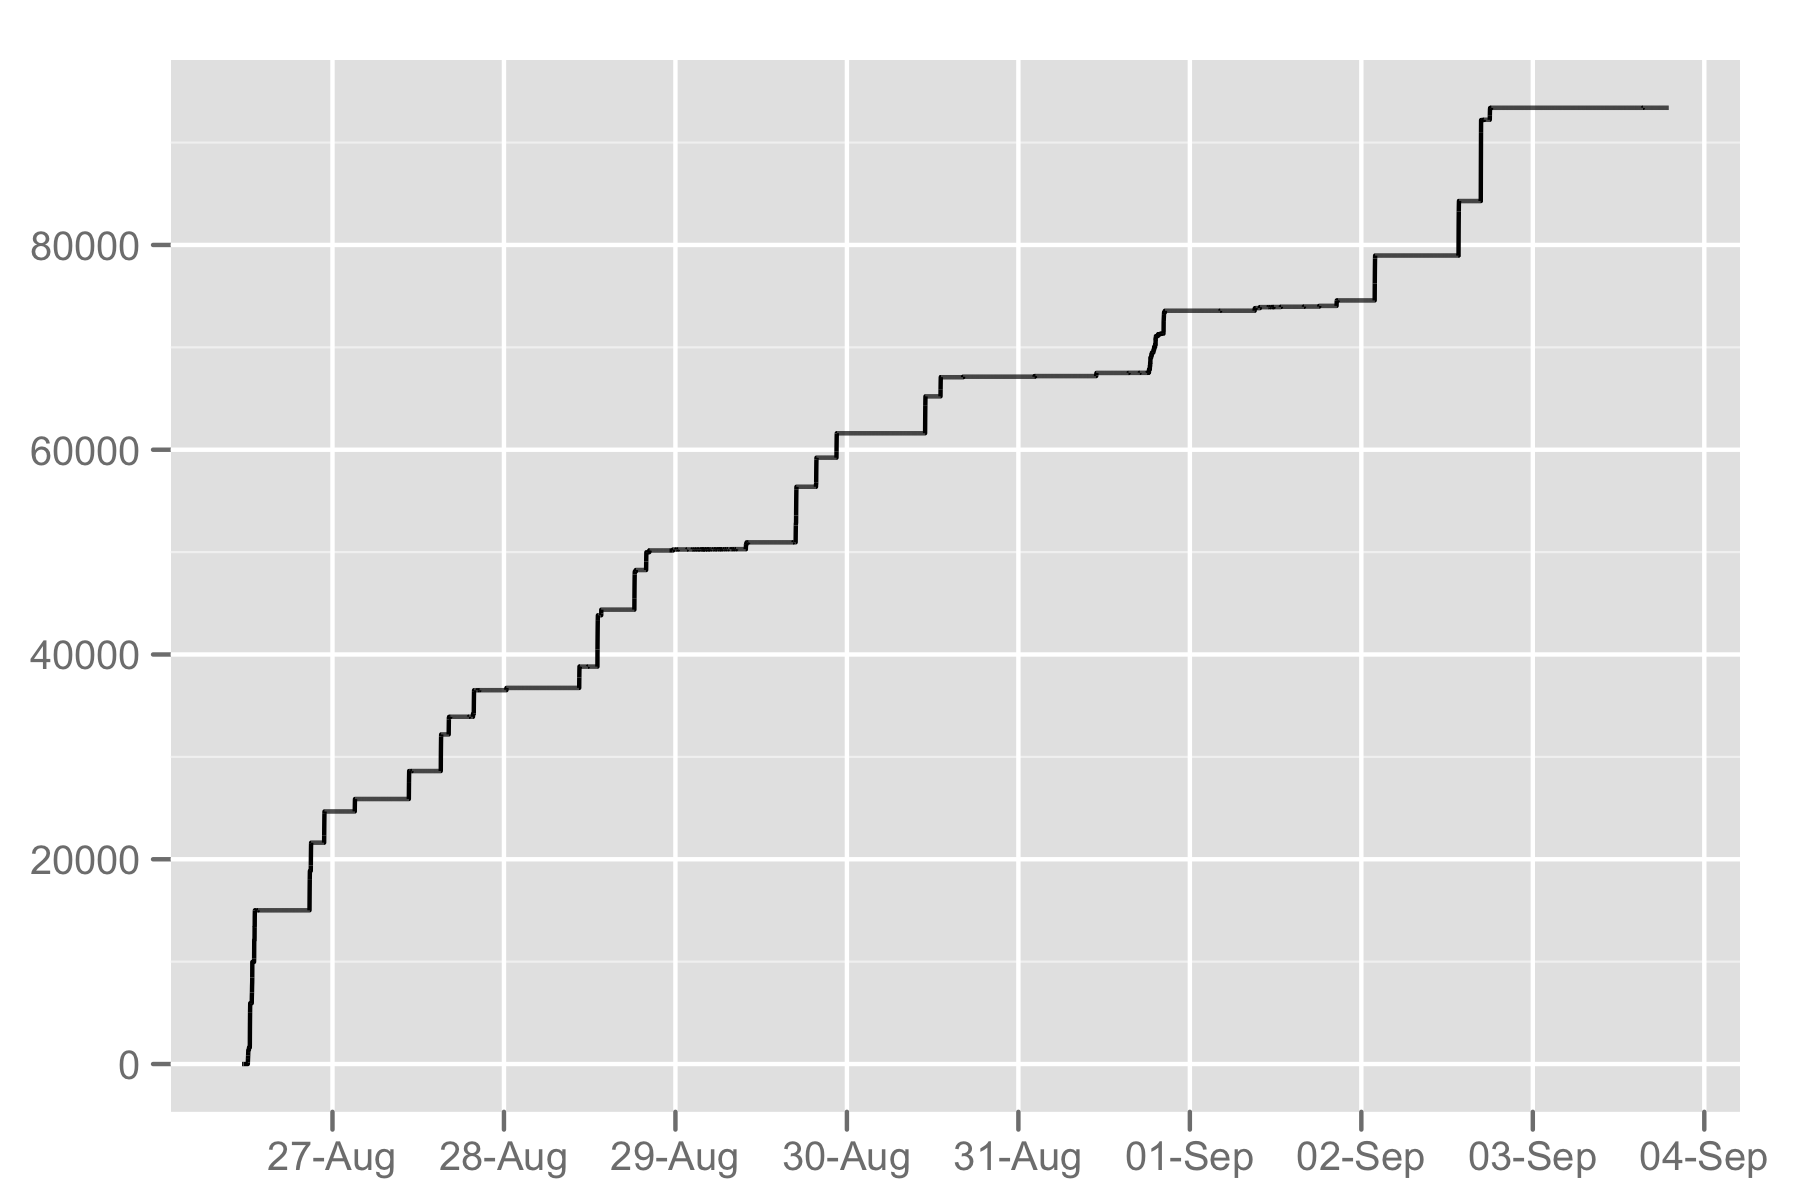
This graph shows the cumulative number of pulses recorded by a flow sensor attached to the filter bucket. All the grey water put into the evapotron went through this sensor. One key finding from this graph is that there are many, many more upward steps in the graph than records in the logbook. People put grey water into the system frequently without recording it. Cheddar worried about this on the last day (when a LOT of grey water went in, starting just after midnight on Sunday 2 Sep: what were people doing putting grey water into the evapotron a couple of hours after the Burn?). However, it seems that people put the odd one or two gallons in throughout the week.

In tests before I built the evapotron, I found that the flow sensor is extremely imprecise. Although it is rated at 192 pulses/liter, in tests I recorded from 160-240 pulses/liter. Given a final count of 93395 pulses, that suggests 128 gallons, in a possible range of 102-153 gallons.

This estimate probably overstates the total because there was about 8 gallons in the system that had to be brought home at the end. Still, given that it ran for 8.5 days, this represents 15 gallons/day (in a range of 12-18 gallons/day).

And there was a second evapotron running. It didn’t do as well, but it handled another 70 or so gallons. Between the two evapotrons, I estimate that we eliminated three-quarters of a ton of grey water. I’m calling this one a success, though there are many lessons learned and better stuff to build for next year.

ImageThe charging circuit worked pretty well. The idea here is that there are two batteries. One is connected to the bus which runs the Arduino, sensors, and pump. The other is connected to the AC charger. The Arduino controls relays which switch the batteries between the two. The upper line in the graph shows the voltage in the bus circuit. When the line is red, battery A is driving the bus. Each time a battery is switched into the bus circuit, it starts with about 13v, then voltage drops as it discharges.

What this graph shows is that the two circuits worked together. In each cycle, the charging circuit (on the bottom) got through the first phase (the slow ramp), then the second phase (the plateau at 14.8 volts), then the third trickle phase (the plateau at about 13.6 volts). When the bus circuit fell below 11 volts, the Arduino flipped the relays, reversing the batteries so the discharged one could charge, and vice-versa.