Archives for the month of: February, 2020

(Updated with info on the Siglent)

A voltnut, or "metrology enthusiast" as our Brit and DownUnder friends say, is a person who gets really excited about knowing to many decimal places how much voltage and current is running through our little devices. I don’t really need all that, but when I’m playing with digital-to-analog conversion, I do need to know pretty accurately what the real analog voltage is.

I’d like to know to the millivolt, which at 5v means 0.02% accuracy, or "4 1/2 digits," in metrology-speak. Turns out that’s about five times more accurate than anything I have now.

This Fluke was built while I was in college.

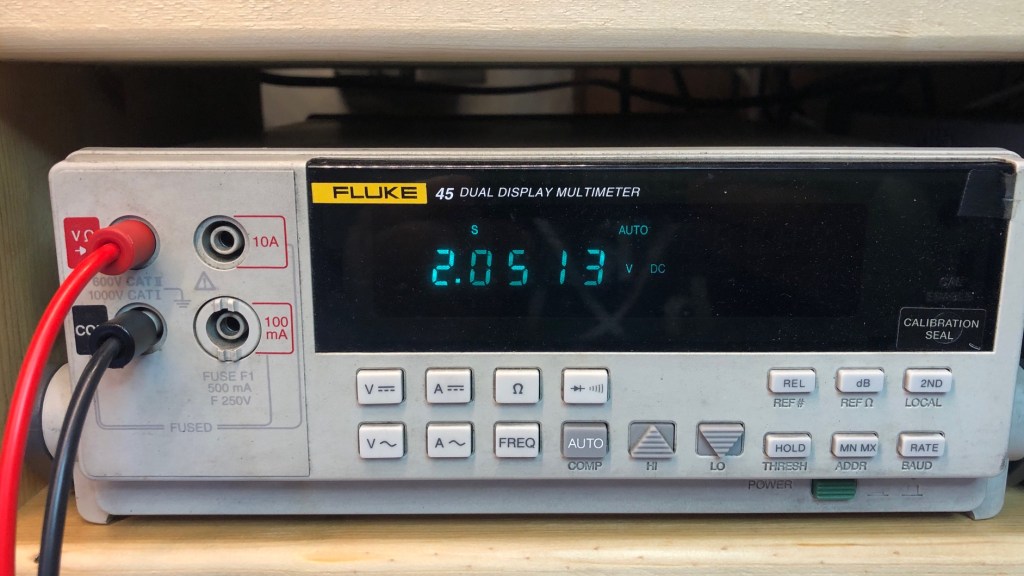
I’ve connected the reference to all threefour of my measurement devices. First I have an ancient but wonderful Fluke 45 multimeter which claims precision to a tenth of a millivolt at the medium reading speed at 3v, or 0.02% (I can’t quite tell from their table). It has a calibration seal dated in December, 2000.

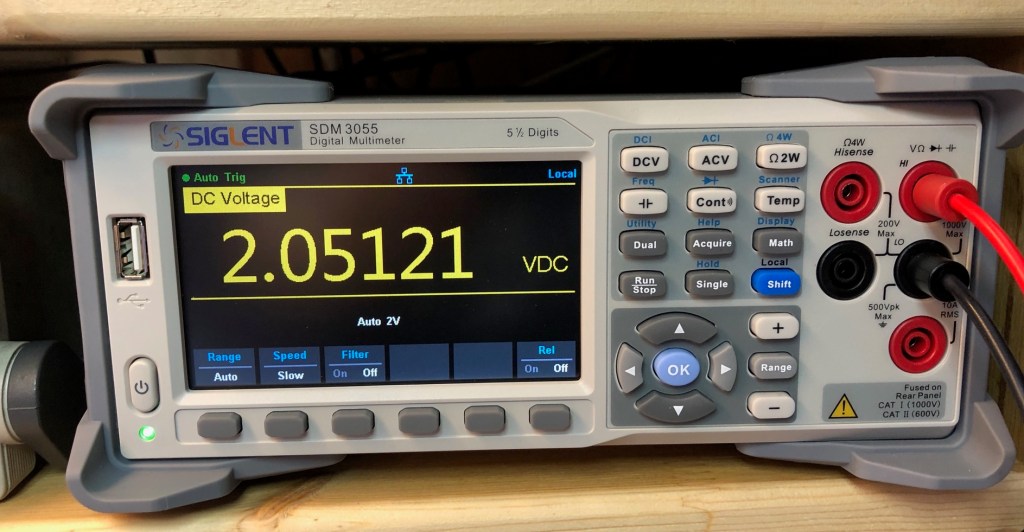
The newest toy on my bench is a Siglent SDM3055 multimeter. I won’t say more about it because mjlorton at YouTube has done a great review. The calibration cert on mine is good thru May 2020.

The Siglent multimeter is gorgeous

Next is my 10-year-old Amprobe 37XR-A, a beefy tool for serious electricians. This beast has been to Burning Man about 8 or so times, but it cleans up nicely for lab work.

Finally I’m using Adafruit’s ina260 voltage and current sensor which they report as "better than 1% accuracy."

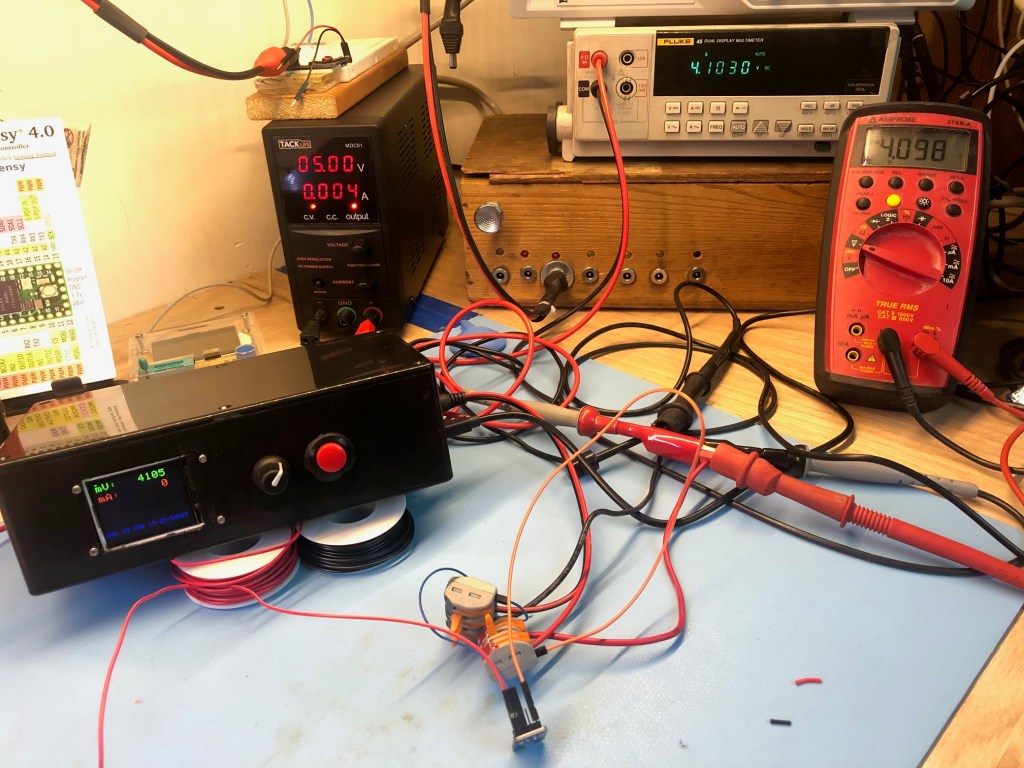
In this test, I’m using Adafruit’s Precision LM4040 Voltage Reference Breakout. I give it about 5v, and it puts out 2.048v or 4.096v at 0.1% accuracy. That means +/- about 2mV and 4mV at the two output voltages, respectively. Setup in the pic below.

Not to put too fine a point on it, I’d like to know which of these devices is the most accurate. Alas, this test doesn’t really tell me. The results are in the table below.

device 2.048v 4.096v
Siglent SDM3055 2.0503 4.1032
Fluke45 2.0506 4.1036
Amprobe 37XR-A 2.047 4.098
ina260 breakout 2.052 4.103

The good news is (i) the calibrated Siglent and the Fluke are indistinguishable at 4.096v, and nearly so at the 2.048v reference (I believe the Siglent). They vary by less than half a millivolt here and in other tests. (ii) The Amprobe and the ina260 are within their tolerances at the 2.048v level, and the Amprobe is still within reference at 4.096.

The ina260 is within it’s stated 1% tolerance, indeed, it’s nearly as good as the other two with better tolerances. This said, it is not a voltmeter: it’s a very delicate IC on a breakout board. Reverse the polarity and you’ll fry the IC, and you can fry an upstream microcontroller’s I2C bus connected to the ina260 board. How do I know this? you wonder.

All this said, I can’t tell from this test which is the most accurate because most of the variation is within the variation on the LM4040. I also bought a AD584 reference, but it produced arbitrary values and seems to be defective.

Three action items emerge: (1) replace the AD584; (2) get the Fluke calibrated. And (3) indulge in a fancy new DMM, which I did. It’s great.

I’m building an r2r ladder which is a way to convert a group of binary voltage inputs to a continuous analog output. For example, an 8-bit r2r ladder would output a single voltage from 0-Vcc at 255 discrete voltage points that are about 20 mV apart.

This is a digital-to-analog conversion (DAC), and I want one in order to build an arbitrary waveform generator (like this one or this one). The DAC will take 8 pins from the arduino, treat them like the bits of a byte, then output a voltage between GND and whatever the Arduino is outputting (Vcc = 3.3 or 5v). That is, we use the DAC to go from a set of digital values in a given waveform to an analog voltage. We need that for any waveform that  has a progression from 0-Vcc, such as a sawtooth, a triangle, or a sine. 

IMG_1091

So I built it, added 8 pins from an Arduino, wrote a sketch to step through 0-255 and write the resulting byte to the 8 pins. I measured the result, and it wasn’t quite what I hoped. First, here’s what it looks like on an oscilloscope. 

DS1Z_QuickPrint5

The problem is those occasional big dropouts, the vertical yellow lines that seem to dribble down off the main diagonal. I wrote the data to a file and started analyzing it. First, the voltage-by-byte. I ran over the 0-255 values 30 times to get a decent distribution. It’s not quite the same as the oscilloscope because the ina260 I used to measure the voltage does two things: first, it measures for 140us, which is about 7000 times slower than the oscope. Second, it measures 16 times and then reports the mean of the measures, so in practice, the ina260 is more than 100,000 times slower than the oscope.

DAC-mV-by-byte

This looks mostly good, except for the two notches which turn out to be at 129 and 178. Yikes, and yuck. If we’re concerned about a stable increment between bytes, let’s look at the first differences, that is, (voltage at byte_k) – (voltage at byte_{k-1}). These are called lagged diffs.

DAC-mV-diff-histogram

As we might expect, the difference clusters around 20mV, which makes plenty of sense. Unfortunately, there’s a second small cluster between -40 and -20. Those turn out to belong to bytes 129 and 174. There’s absolutely nothing interesting about those values, in a binary sense, which is a clue that this isn’t about a wiring error. If the glitches happened at 32 or 64 or 128, that would suggest that I’d done something wrong at a specific resistor.

Looking at the histogram just for 129, 174 there’s also nothing special in the distribution of lagged diffs.

Back to basics: what’s an r2r network anyway? Basically it’s a big voltage divider, and the stability of the output depends on the ratios among the resistances.

The reason we use the r2r pattern is specifically because the combination of 8 voltage dividers in one circuit allows each bit to contribute a unique chunk of voltage to the output. For example, the least significant bit of an 8-bit ladder contributes b/2^8 volts, where b is either 0 (if the bit is 0) or Vcc  if the bit is 1. The next-least-significant bit contributes b/2^7 volts, and the one after that contributes b/2^6 volts, etc. The sum of these 8 contributions creates 255 unique voltage values.

That transformation works because in the voltage divider, all the r values are the same, and the 2r values are the same and = 2*r. But unfortunately, that’s not how most resistors really are. The ones I have on hand are 5% tolerances, so r is around 10K, and 2r is in the neighborhood of 20K. I started testing the resistances, and they came in between 9766 and 10055 ohms; the 2r values came in 19789-20129 ohms. These bits of imprecision yield enough weirdness to create the notches and nonlinearities in the graphs above.

Hmm. After a little reading, it became clear that this is how r2r networks fail: inconsistent values, and even more, inconsistent r/2r ratios, lead to nonlinearities –glitches — in the progression of output voltages. This is exactly what I’m seeing. There’s even a Hackaday post about trimming resistors to make them more consistent for this purpose.

I’m not going to do that because I’m lazy. I ordered a few 10K and 20K resistors with 0.1% tolerances from Mouser, and I’ll try again when they arrive.